Physiology Reference
Use this page when you need to explain what the SDK is actually simulating, what its numbers mean, and which quantities are physiological, measurement-related, or purely protective software limits.
Scope: - pre-clinical simulation and retrospective research only - not a treatment recommendation engine - not a medical device
The short version: - the SDK simulates glucose-insulin physiology - it can add CGM measurement behavior - it reports against clinical interpretation anchors - it enforces separate software safety rails
For live presentations, the same material is also available as:
- research/eucys_pack/pdf/EUCYS_05_PHYSIOLOGY_REFERENCE_BROCHURE.pdf
- research/eucys_pack/pdf/EUCYS_06_JURY_PHYSIOLOGY_BRIEF.pdf
Keeping those four ideas separate is important. A glucose target, a sensor plausibility bound, and a supervisor stop rule are all numbers in mg/dL, but they do not mean the same thing.
1. The Three Layers
| Layer | What it represents | Main SDK components | Examples |
|---|---|---|---|
| Physiological state | What happens inside the virtual patient | CustomPatientModel, BergmanPatientModel, patient profiles, stress events |
glucose, insulin action, carbs on board, exercise, dawn phenomenon |
| Measurement layer | What the virtual CGM reports to the algorithm | SensorModel, named sensor profiles |
lag, noise, drift, dropout, compression lows |
| Interpretation and protection | How results are summarized or constrained | clinical metrics, realism checks, SafetyConfig, supervisor |
TIR, hypo bands, maximum bolus, critical-stop logic |
2. What The SDK Physiologically Represents
| Concept | SDK representation | Why it matters |
|---|---|---|
| Blood glucose | current_glucose in mg/dL |
Primary physiological state and report axis |
| Insulin exposure | insulin doses, insulin-on-board (IOB), insulin action curve | Separates delivered insulin from insulin that is still active |
| Carbohydrate exposure | meal events, delayed absorption, carbs-on-board (COB) | Prevents meals from becoming impossible instant spikes |
| Basal physiology | homeostatic drift toward a basal target | Prevents the simplified model from drifting endlessly without disturbances |
| Circadian variation | optional dawn phenomenon window; Hovorka-style runs gate the Fourier EGP oscillator behind dawn_phenomenon_strength |
Lets early-morning glucose rise be represented explicitly without hidden always-on drift |
| Exercise | bounded event intensity from 0.0 to 1.0 |
Adds glucose-lowering stress independent of insulin dosing |
| Stress / illness physiology | stress events, stress hormones/pseudo-hormones in supported models | Lets glucose rise without a meal because of stress-mediated insulin resistance and increased endogenous glucose production |
| Hypoglycemia defense systems | experimental counterregulation, HAAF, glucagon, and renal-clearance layer | Makes explicit which rescue mechanisms are implemented experimentally and which assumptions still need calibration |
| Stem-cell / islet graft research | optional Bergman-mode graft mass state M_graft with glucose-responsive insulin secretion |
Lets researchers explore simplified engraftment, placement-delay, and rejection hypotheses without claiming clinical transplant prediction |
| Meal mismatch | meal_mismatch_epsilon |
Distinguishes announced carbohydrate from true carbohydrate exposure |
| Measurement imperfections | CGM lag, bias, random noise, drift, dropout, compression lows | Lets algorithms be tested against what a sensor would report, not only perfect latent glucose |
| Empirical residual variation | optional additive residual profile | Adds real-data-like day-scale irregularity on top of the mechanistic trajectory |
3. Numbers That Matter Clinically
These are interpretation anchors, not automatic proof that a simulation is clinically valid.
| Quantity | Number | Meaning |
|---|---|---|
| Target glucose range used for TIR | 70-180 mg/dL |
Standard CGM target band used in SDK reports |
| Level 1 hypoglycemia | 54-69 mg/dL |
Below range, but above the level-2 threshold |
| Level 2 hypoglycemia | <54 mg/dL |
Clinically important low-glucose threshold |
| Common adult CGM target | >70% time in 70-180 mg/dL |
Interpretation target for many nonpregnant adults using CGM |
| Common adult time-below-range target | <4% below 70 mg/dL |
Interpretable as less than about 58 minutes per day |
| Common adult severe-low target | <1% below 54 mg/dL |
Interpretable as less than about 15 minutes per day |
The glucose bands and CGM targets above follow the international Time in Range consensus and the 2026 ADA Standards of Care. The SDK uses them for reporting language; it does not claim that a run meeting those numbers is automatically clinically proven. Evidence Base collects the full source legend.
4. SDK Safety Rails Are A Different Kind Of Number
These values are deliberately conservative software controls. They protect simulations and supervisor behavior; they are not personalized clinical prescriptions.
| Safety rail | SDK default | What it does |
|---|---|---|
| Hypoglycemia threshold | 70 mg/dL |
Marks low-glucose risk |
| Severe hypoglycemia threshold | 54 mg/dL |
Marks a more serious low-glucose state |
| Hyperglycemia threshold | 250 mg/dL |
Marks high-glucose risk for supervision |
| Critical termination rule | <40 mg/dL for 30 min |
Stops a run after sustained extreme low glucose |
| Maximum bolus | 5.0 U |
Blocks a single excessive requested dose |
| Maximum insulin per hour | 3.0 U |
Limits recent cumulative delivery |
| Maximum insulin on board | 4.0 U |
Limits active insulin burden |
| Falling-trend stop | -2.0 mg/dL/min |
Helps block dosing when glucose is falling quickly |
| Plausible sensor range | 40-500 mg/dL |
Broad fail-soft bound for incoming CGM-like readings |
| Maximum plausible CGM change | 20 mg/dL per 5 min |
Flags implausibly abrupt sensor movement |
5. Patient Parameters
| Parameter | Unit | Physiological meaning | Current validation range | Typical role in the SDK |
|---|---|---|---|---|
initial_glucose |
mg/dL | Starting glucose state | 40-400 |
Sets the opening condition of a run |
basal_insulin_rate |
U/hour | Background insulin delivery | 0.0-3.0 |
Basal exposure available to algorithms and reports |
insulin_sensitivity / isf |
mg/dL per U | How strongly 1 U of insulin lowers glucose | 10-200 |
Converts insulin action into glucose effect |
carb_factor / icr |
g per U | Carbohydrate covered by 1 U of insulin | 3-30 |
Couples announced meal size to bolus logic |
glucose_decay_rate |
per-minute coefficient | Homeostatic drift back toward a basal glucose target | 0.0-0.2 |
Simplified stabilizing term, not a standalone clinical biomarker |
glucose_absorption_rate |
model gain | Strength of meal-to-glucose rise in the simplified model | 0.0-0.2 |
Controls carbohydrate impact in the custom model |
insulin_action_duration |
min | Duration over which a dose remains active | 60-720 |
Defines IOB decay and total insulin-action window |
insulin_peak_time |
min | Time of peak activity inside the dose-action curve | 15-240, below duration |
Shapes early versus late insulin effect |
meal_mismatch_epsilon |
ratio | true carbs / announced carbs |
0.5-1.5 |
Models under- or over-estimation of meals |
dawn_phenomenon_strength |
mg/dL/hour | Extra early-morning rise or, in Hovorka-style mode, the scale of the dawn EGP oscillator | 0-50 |
Adds explicit circadian disturbance |
dawn_start_hour, dawn_end_hour |
hour of day | Dawn-effect window | 0-23, 0-24 |
Defines when dawn physiology is active |
stem_cell_engraftment_percent |
percent | Experimental functional beta-cell/islet graft fraction in Bergman mode | 0+, usually 0-100 for demos |
Scales glucose-responsive endogenous insulin secretion through M_graft |
stem_cell_subq_fraction |
ratio | Fraction of graft secretion routed through the subcutaneous insulin depot chain | 0-1 |
Separates portal/direct appearance from delayed subcutaneous appearance |
immune_rejection_rate |
1/min | Exponential graft-mass decay coefficient | >=0 |
Simulates simplified loss of functional graft mass over time |
One important reading tip:
- glucose_decay_rate is a model coefficient, not a directly measured patient value.
- insulin_sensitivity, ICR, basal rate, insulin duration, and starting glucose are the quantities that map most naturally to human-facing interpretation.
6. Built-In Starter Profiles
These are the CLI presets intended for first use and reproducible demos.
| Preset | Initial glucose | Basal | ISF | ICR | Drift coefficient | Best use |
|---|---|---|---|---|---|---|
stable-demo |
130 mg/dL |
0.2 U/h |
40 mg/dL/U |
15 g/U |
0.001 |
smoke tests and teaching demos |
stress-test |
120 mg/dL |
0.5 U/h |
50 mg/dL/U |
10 g/U |
0.003 |
stronger disturbances and supervisor tests |
endurance |
140 mg/dL |
0.0 U/h |
20 mg/dL/U |
25 g/U |
0.0 |
long unattended software-endurance runs |
7. Bundled Reference Patient Profiles
These profiles are shipped with the SDK for studies, demos, and physiological comparisons.
| Profile | Initial glucose | Basal | ISF | ICR | Special physiology | Intended use |
|---|---|---|---|---|---|---|
clinic_safe_baseline |
140 |
0.50 |
50 |
10 |
none | calm benchmark baseline |
clinic_safe_stress_meal |
120 |
0.40 |
55 |
11 |
none | meal-stress benchmark |
clinic_safe_hypo_prone |
130 |
0.35 |
55 |
12 |
none | overnight hypo-risk challenge |
clinic_safe_hyper_challenge |
150 |
0.55 |
45 |
9 |
none | post-meal high-glucose challenge |
clinic_safe_midnight |
125 |
0.45 |
65 |
11 |
none | exercise-after-evening-meal challenge |
clinic_safe_pizza |
135 |
0.50 |
50 |
10 |
none | delayed-meal challenge |
reference_free_living_t1d |
151.7 |
0.50 |
50 |
10 |
Ohio-informed basal target 147, carb tail 270 min, meal mismatch 0.83 |
empirical free-living reference |
reference_azt1d_t1d |
135 |
0.50 |
50 |
10 |
dawn rise 4 mg/dL/h, meal mismatch 0.95 |
AZT1D-oriented reference |
reference_hupa_ucm_t1d |
130 |
0.50 |
50 |
10 |
dawn rise 8 mg/dL/h, meal mismatch 0.95 |
HUPA-UCM-oriented reference |
default_patient |
120 |
0.80 |
50 |
10 |
legacy simplified defaults | compatibility, not the best first demo choice |
patient_559_config |
130 |
0.90 |
45 |
12 |
slower drift, longer insulin action | alternate legacy virtual patient |
Units:
- glucose in mg/dL
- basal in U/hour
- ISF in mg/dL/U
- ICR in g/U
Stem-Cell / Islet Graft Abstraction
The SDK contains a small Bergman-mode research extension for stem-cell or islet-graft hypotheses. It is deliberately simple:
The secretion term is split by placement:
S_plasma enters plasma insulin directly, while S_subq first enters the two-depot subcutaneous insulin absorption chain. This lets the simulator distinguish an immediate portal/direct abstraction from a delayed subcutaneous graft abstraction.
Important limitation: this is not a validated stem-cell therapy model. It does not simulate differentiation, vascularization, encapsulation, immune-cell populations, immunosuppressive drugs, or transplant eligibility. It is an educational algorithm-stress tool for asking "what if functional insulin secretion appeared, lagged, or decayed?"
Multi-Compartment Transplant Research Engine
For deeper experiments, iints.research.stem_cell_transplant adds a separate deterministic transplant engine. Unlike the minimal M_graft abstraction above, this runner tracks several graft-level states:
| State | Meaning |
|---|---|
immature_mass |
cells that are present but not yet fully glucose-responsive |
functional_mass |
beta-like mass that can secrete insulin |
vascularization |
local blood-supply support for the graft |
oxygenation |
oxygen availability after vascularization, fibrosis, and graft demand |
innate_inflammation |
early inflammatory stress after implantation |
adaptive_immunity |
slower immune pressure against visible graft cells |
fibrosis |
encapsulation/scarring barrier that reduces diffusion and function |
insulin_delay_pool_units |
delayed insulin release pool for subcutaneous or encapsulated sites |
The model uses placement presets:
| Placement | Intended abstraction |
|---|---|
portal |
liver/portal-style graft with fast plasma insulin appearance but high early inflammatory exposure |
subcutaneous |
slower, initially oxygen-limited site with delayed insulin appearance |
encapsulated |
immune-shielded but diffusion/fibrosis-limited graft |
The core update is still deliberately transparent:
Insulin secretion is glucose-responsive:
The runner couples this graft output back into a Bergman virtual patient. Portal-style release is added to plasma insulin; delayed/subcutaneous release goes through the two-depot insulin absorption chain. This is much closer to a transplant stress simulator, but it remains pre-clinical research software, not a therapy predictor.
8. A Full Day That Actually Means Something
The current realistic day presets are intentionally not flat. They encode meals, delays, exercise, and a snack so that a glucose plot has a plausible daily story.
| Preset event | Time | Value | Why it exists |
|---|---|---|---|
| breakfast | 07:30 |
48 g carbs |
first post-prandial excursion |
| lunch | 12:15 |
62 g carbs |
larger midday disturbance |
| exercise | 12:45 |
intensity 0.35 for 30 min |
glucose-lowering counterpressure after lunch |
| dinner | 18:00 |
74 g carbs |
largest daily meal challenge |
| snack | 21:30 |
18 g carbs |
small late-day excursion |
The free_living_t1d preset uses a related but slightly lighter pattern:
| Event | Time | True carbs / intensity | Reported carbs | Duration |
|---|---|---|---|---|
| breakfast | 08:00 |
42 g |
39.9 g |
40 min |
| lunch | 12:00 |
59 g |
57.8 g |
50 min |
| exercise | 16:30 |
intensity 0.1 |
n/a | 35 min |
| dinner | 18:00 |
68 g |
66.6 g |
60 min |
| snack | 21:30 |
12 g |
12 g |
40 min |
That second table matters because it shows a realistic research distinction: - true carbs affect physiology - reported carbs are what the algorithm believes
9. Scenario Event Semantics
| Event type | Main fields | Physiological meaning |
|---|---|---|
meal |
value, optional reported_value, absorption_delay_minutes, duration |
Real carbohydrate intake with optional annotation error and delayed absorption |
missed_meal |
value |
Carb exposure not properly announced to the controller |
exercise |
value from 0.0 to 1.0, duration |
Increased glucose use / falling-glucose challenge |
exercise_end |
none required | Explicitly ends an exercise phase |
sensor_error |
value |
Measurement disturbance, not true physiology |
ratio_change |
isf, icr, basal_rate, dia_minutes |
Time-varying therapy ratios, useful for sensitivity studies |
10. Sensor Profiles
The algorithm normally sees CGM-like readings, not necessarily the latent glucose state.
| Sensor profile | Noise SD | Blood-to-ISF lag | ISF tau | Noise memory | Dropout probability | Drift cap | Compression low behavior |
|---|---|---|---|---|---|---|---|
ideal |
0 mg/dL |
0 min |
5 min |
none | 0 |
0 mg/dL |
none |
clinical_cgm |
5 mg/dL |
5 min |
10 min |
AR(1) colored noise | 0 |
0 mg/dL |
none |
free_living_cgm |
8 mg/dL |
10 min |
10 min |
long-memory approximation, H=0.75 |
0.004 |
18 mg/dL |
occasional 10-26 mg/dL lows |
compression_prone |
8.5 mg/dL |
12 min |
12 min |
long-memory approximation, H=0.78 |
0.003 |
20 mg/dL |
stronger 18-42 mg/dL compression lows |
The purpose of these profiles is not to declare one CGM brand "correct." They provide repeatable measurement stress levels for algorithms and supervisor logic. The long-memory sensor mode is a compact multi-scale AR approximation inspired by fractional-noise theory; it is not an exact vendor CGM model or exact fBM sampler.
11. Model Families
| Model | Main internal states | Strength | Best use |
|---|---|---|---|
CustomPatientModel |
glucose, IOB, COB, active insulin doses, active carb intakes, exercise state | fast, transparent, easy to stress-test | quick demos, regression tests, safety sweeps |
BergmanPatientModel |
plasma glucose G, remote insulin action X, plasma insulin I, stomach glucose, gut glucose |
more mechanistic ODE structure with gut compartments | physiology-focused studies |
HovorkaPatientModel |
19-state experimental ODE: glucose compartments, gut absorption, subcutaneous insulin/glucagon depots, plasma hormones, insulin action, HAAF memory, GLUT4 exercise state | richer compartmental ODE-style physiology with exposed internal states | research simulations that need active insulin, glucagon, insulin effect, exercise, stress, and hypoglycemia-defense assumptions |
EmpiricalResidualModel |
additive day-scale residual template | adds real-data-like irregularity to an otherwise clean trajectory | realism studies and synthetic-mirror work |
Bergman defaults
| Parameter | Default | Meaning |
|---|---|---|
p1 |
0.028 1/min |
insulin-independent glucose uptake |
p2 |
0.025 1/min |
decay of remote insulin action |
p3 |
5.0e-6 (mU/L)^-1 min^-2 |
insulin-action gain |
Gb |
120 mg/dL |
basal glucose |
n |
0.23 1/min |
insulin degradation |
Ib |
7 mU/L |
basal plasma insulin |
tau_meal |
40 min |
gastric-emptying time constant |
k_abs |
0.05 1/min |
intestinal absorption rate |
f_bio |
0.90 |
absorbed fraction |
gamma |
0.0 |
endogenous insulin secretion gain; defaulted to zero for T1D mode |
The ODE structure is inspired by the Bergman minimal-model tradition and meal-compartment work such as Dalla Man et al.; the SDK still remains a research simulator rather than a clinical digital twin.
Hovorka-style model notes
The experimental Hovorka-style model is intended for research runs that need clearer separation between delivered insulin, subcutaneous insulin absorption, plasma insulin, delayed insulin action, exogenous glucagon, exercise-driven GLUT4/NIMGU, and hypoglycemia-defense assumptions. It is useful for AI and MPC experiments because the controller can inspect internal state variables instead of treating glucose as the only signal.
Molecular context, not simulator state
The images below explain which proteins motivate two model abstractions. The ODE state does not contain atomic coordinates, and the AlphaFold models do not calculate glucose transport or hormone response.
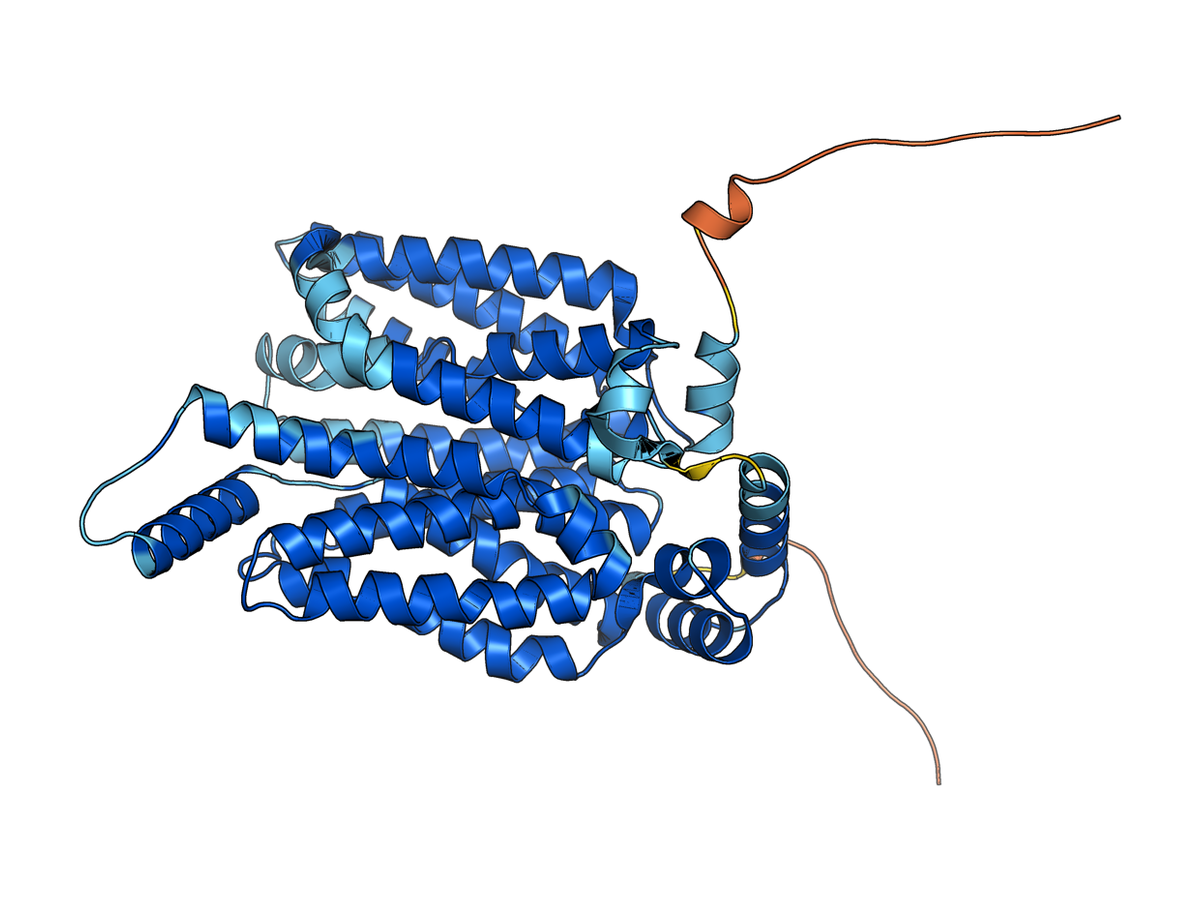
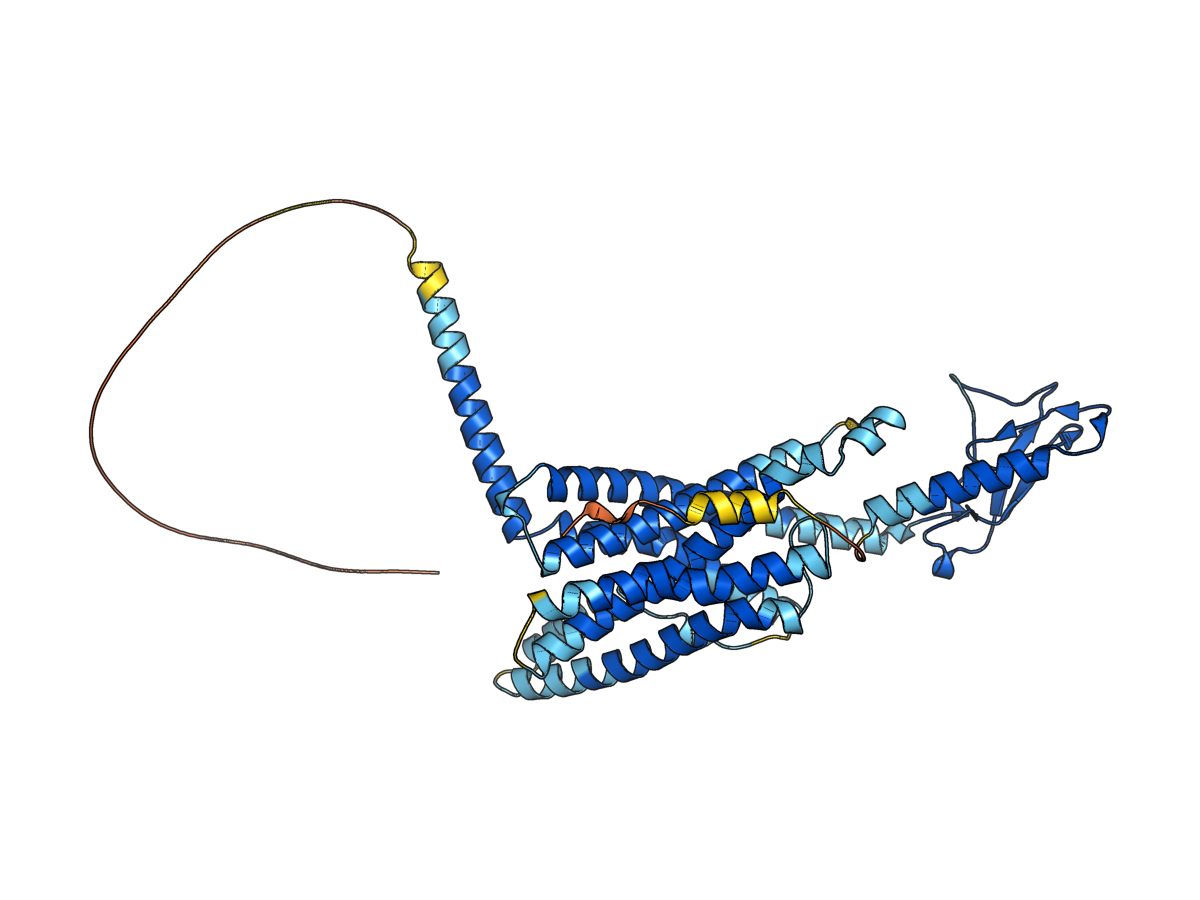
See Digital Twin Biology for the pLDDT key, model provenance, PAE workflow, and interpretation limits.
Current experimental extensions:
- GLP-1-style gastric-emptying feedback slows meal appearance when intestinal glucose is high.
- GLUT4/NIMGU exercise state increases non-insulin-mediated muscle glucose uptake during exercise.
- Dawn/circadian EGP uses a bounded Fourier-series modifier, but only when dawn_phenomenon_strength is enabled.
- HAAF and counterregulation expose repeated-low memory and blunted rescue behavior for research discussions.
- Renal glucose clearance uses a smooth threshold/splay-style curve instead of a hard cutoff.
Important boundary: - the implementation is for simulation research and education - parameters are not personalized clinical estimates - stress and exercise modifiers are intentionally explicit so assumptions can be audited
12. Real-Data Physiology Calibration
The SDK now includes a calibration-audit step for processed real CGM datasets such as OhioT1DM. This does not identify a clinical digital twin. It measures empirical glucose-shape features and turns them into conservative simulator parameter hints.
Example:
iints research physiology-calibrate \
  --real-data data_packs/public/ohio_t1dm_full/processed/ohio_train.csv \
  --output-json results/physiology_calibration/ohio_report.json \
  --output-profile results/physiology_calibration/ohio_profile_hints.yaml
The report computes: - dataset-level mean, CV, time-in-range, hypo/high percentages, and rate-of-change tails - post-meal peak timing and peak amplitude when carbohydrate events are available - exercise-response summaries when exercise/activity flags are available - dawn rise estimates from overnight versus early-morning CGM medians
The generated profile hints include:
- initial_glucose
- basal_glucose_target
- carb_absorption_duration_minutes
- glucose_absorption_rate
- max_glucose_rate_mgdl_per_min
- dawn_phenomenon_strength
Interpretation rule: - use the hints as starting points for simulator presets - validate the resulting simulator runs with realism checks and AGP/report outputs - do not present the hints as individualized clinical parameters
Current OhioT1DM aggregate calibration run:
| Split | Rows | Subjects | Mean glucose | TIR 70-180 | Median post-meal peak | Raw hint summary |
|---|---|---|---|---|---|---|
| train | 153,055 | 12 | 159.174 mg/dL | 63.916% | 110.0 min | initial 151.2, basal target 147.0, carb duration 331.5 min |
| test | 35,925 | 12 | 161.584 mg/dL | 63.468% | 97.5 min | initial 153.233, basal target 148.0, carb duration 272.0 min |
| all | 188,980 | 12 | 159.632 mg/dL | 63.831% | 110.0 min | initial 151.733, basal target 148.2, carb duration 323.0 min |
The public reference_free_living_t1d profile uses a gate-compatible calibration compromise: it adopts the Ohio train basal target (147.0 mg/dL) while keeping carbohydrate absorption at 270.0 min because the raw train duration hint (331.5 min) made the current preset realism gate fail on baseline/free-living regression tests. This is intentional: real-data hints must pass simulator realism checks before becoming defaults.
13. Experimental Or Not Fully Calibrated Yet
| Not fully represented | Current SDK handling |
|---|---|
| endogenous glucagon and epinephrine counterregulation | implemented experimentally in the Hovorka-style model; current runs should not be interpreted as calibrated hormone assays |
| HAAF and hypo-awareness memory | implemented as an experimental bounded memory state; not a clinically validated predictor of awareness or severe-hypoglycemia risk |
| exogenous glucagon PK/PD for dual-hormone pumps | implemented as an experimental Hovorka-style depot/plasma/effect layer with simulator safety caps; not emergency-dose guidance |
| illness, infection, menstrual cycle, steroid exposure | approximated through scenario disturbances and stress events; not a complete endocrine illness model |
| fat/protein mixed-meal kinetics | approximated with delayed meal profiles such as pizza_paradox |
| GLP-1 / incretin physiology | represented as a bounded meal-emptying modifier, not a personalized incretin hormone assay |
| circadian endocrine rhythms | represented as an optional dawn EGP oscillator, not a full cortisol/growth-hormone model |
| exercise GLUT4 translocation | represented as a bounded NIMGU state, not a calibrated muscle-biopsy model |
| renal glucose losses | implemented as a smooth threshold/splay-style clearance term; not a personalized renal function model |
| individualized pharmacokinetics for every insulin formulation | represented through configurable duration/peak parameters, not full formulation-specific PK for every commercial insulin |
| long-horizon adaptation in real patients | studied through scenarios and residuals, not a personalized adaptive physiological twin |
14. Hypoglycemia Science Layer
The experimental hypoglycemia layer is organized around four explicit pillars. This is important because a simulator that only models carbohydrates and insulin can look plausible while still missing the body's rescue systems.
| Pillar | Model idea | Status | Main source anchors |
|---|---|---|---|
| Endogenous counterregulation | Low glucose and fast downward trends drive rescue states that raise endogenous glucose production and reduce effective insulin sensitivity | experimental | gerich_1979_counterregulation, cryer_2013_haaf_mechanisms |
| HAAF memory | Recent time-below-range increases a slow memory state that blunts later rescue response | experimental | cryer_2013_haaf_mechanisms, cryer_2013_haaf_diabetes |
| Exogenous glucagon PK/PD | Dual-hormone research separates delivered glucagon, subcutaneous depot, plasma appearance, and delayed glucose effect | experimental | lv_2013_exogenous_glucagon_pk, haidar_2013_insulin_glucagon_pk, haidar_2013_dual_hormone_ap |
| Renal glucose clearance | Hyperglycemic renal loss is represented as a smooth threshold/splay-style curve instead of an abrupt cutoff | experimental | hummel_2018_renal_glucose_handling, defronzo_2013_renal_reabsorption_splay |
For the full explanation and equations, see Hypoglycemia Science Model.
15. How To Use This In A Presentation
For a doctor: - start with the glucose bands, hypo thresholds, and what the patient model includes - then show that measurement imperfections and supervisor limits are separate layers
For an engineer: - start with the patient-parameter table and model-family table - then show that the same physiology can be replayed under different sensor and algorithm conditions
For EUCYS: - say that the SDK is not only "drawing glucose curves" - say that it exposes the assumptions behind the curves: patient ratios, meals, exercise, sensor behavior, and safety rails - use the day table and patient-profile table as concrete evidence that the simulator is parameterized, inspectable, and reproducible
16. Source Trail
Use these pages together: - Evidence Base for the literature legend - Scientific Workflow for study design - Study Analysis for outcome interpretation - API Reference for implementation symbols
Key external anchors used by this page: - ADA Professional Practice Committee, Glycemic Goals, Hypoglycemia, and Hyperglycemic Crises: Standards of Care in Diabetes-2026. - Battelino et al., Clinical Targets for Continuous Glucose Monitoring Data Interpretation. - Bergman et al., Quantitative estimation of insulin sensitivity. - Hovorka et al., Nonlinear model predictive control of glucose concentration in subjects with type 1 diabetes. - Dalla Man et al., Meal simulation model of the glucose-insulin system. - Gerich et al., Hormonal mechanisms of recovery from insulin-induced hypoglycemia in man. - Cryer, Mechanisms of Hypoglycemia-Associated Autonomic Failure in Diabetes. - Lv et al., Pharmacokinetics modeling of exogenous glucagon in type 1 diabetes mellitus patients. - Hummel et al., Physiology of renal glucose handling via SGLT1, SGLT2 and GLUT2. - Riddell et al., Exercise management in type 1 diabetes: a consensus statement. - Mandelbrot and Van Ness, Fractional Brownian Motions, Fractional Noises and Applications. - Campbell et al., Pathogenesis of the Dawn Phenomenon in Patients with Insulin-Dependent Diabetes Mellitus. - Richter and Hargreaves, Exercise, GLUT4, and skeletal muscle glucose uptake. - Naslund et al., GLP-1 slows solid gastric emptying and inhibits insulin, glucagon, and PYY release in humans.
Mathematical Appendix: Tissue-Specific Resistance
To isolate molecular receptor affinity, peripheral resistance, and hepatic resistance, the Hovorka-style insulin action gains are scaled deterministically before ODE integration. The molecular scalar (\(A_{scalar}\)) applies to the receptor/action channels globally, while the GTEx-inspired muscle and liver scalars (\(M_{scalar}\) and \(L_{scalar}\)) separate peripheral glucose disposal from hepatic EGP suppression. This ensures mathematical stability at \(t=0\) while enabling dynamic stressor testing:
This formulation allows the simulator to trigger global INSR-style resistance (driven by \(A_{scalar}\)), fasting hyperglycemia (driven by a reduction in \(L_{scalar}\)), or post-prandial absorption failures (driven by a reduction in \(M_{scalar}\)), forcing candidate algorithms to handle distinct physiological phenotypes.